 AI Tools Review Editorial Team
Quick Answer:
Anthropic launched Claude Dashboards (paid plans, beta) and Claude Motion (Team and Enterprise, beta) on 08/10/2026. Dashboards turns a plain-language question into live charts from sources such as Snowflake, BigQuery, Databricks, Redshift, ClickHouse and Salesforce, shows the query behind every number and the last refresh time, and keeps updating. Motion writes code, not generative video, to animate your text, charts and images, and exports MP4. Docs, Slides and Design also left beta and now reach every plan, including Free. Anthropic has published no accuracy or refresh-rate figures.
Most companies already have more data than they have time to chart. Anthropic’s latest Claude update goes after that gap with two beta features: Dashboards, which builds and maintains live charts from your data warehouse, and Motion, which turns reports into short animated explainers.
Julian Goldie’s video summary of the launch calls them dashboards that update themselves and animated explainers made from editable code. That is accurate to Anthropic’s own description. This guide covers what each feature does, who gets it, what it connects to, what Anthropic has not said, and how to try it safely.
Julian Goldie walks through Claude\u2019s new Dashboards and Motion features.
Executive Summary
- Dashboards (beta, paid plans): ask a question, Claude pulls the data, builds the dashboard and keeps it updated. Every number links to its query.
- Motion (beta, Team and Enterprise): prompts become short animations, edited in an editor or by asking Claude, exported as MP4. Built as code rather than generated video.
- Docs, Slides and Design: out of beta, available on every plan including Free. Anthropic says more than 45 million docs, decks and designs have been created in Claude.
- Claude Design: now works inside Claude conversations; the standalone site stays until 14/12/2026.
- Not published: accuracy results, refresh frequency, exact tier pricing, usage or file-size limits.
Our view: Dashboards is the more consequential feature, because it puts an AI analyst on top of the warehouse with an audit trail. Motion is a neat finishing tool for teams that already present data. Both are betas and should be used with checks. If you are weighing Claude against other assistants for office work, read our ChatGPT Work guide for the comparison.
Claude Dashboards: How They Work
Anthropic’s help article describes a simple flow. You ask a question in plain language, Claude pulls the answers from your connected data, builds the dashboard and keeps it updated as the data changes. Press coverage adds that Claude writes a SQL query for each chart and runs it against the connected source; the official page says you can click any number to see its underlying query or ask Claude to explain it, and that each chart shows when its data was last refreshed.
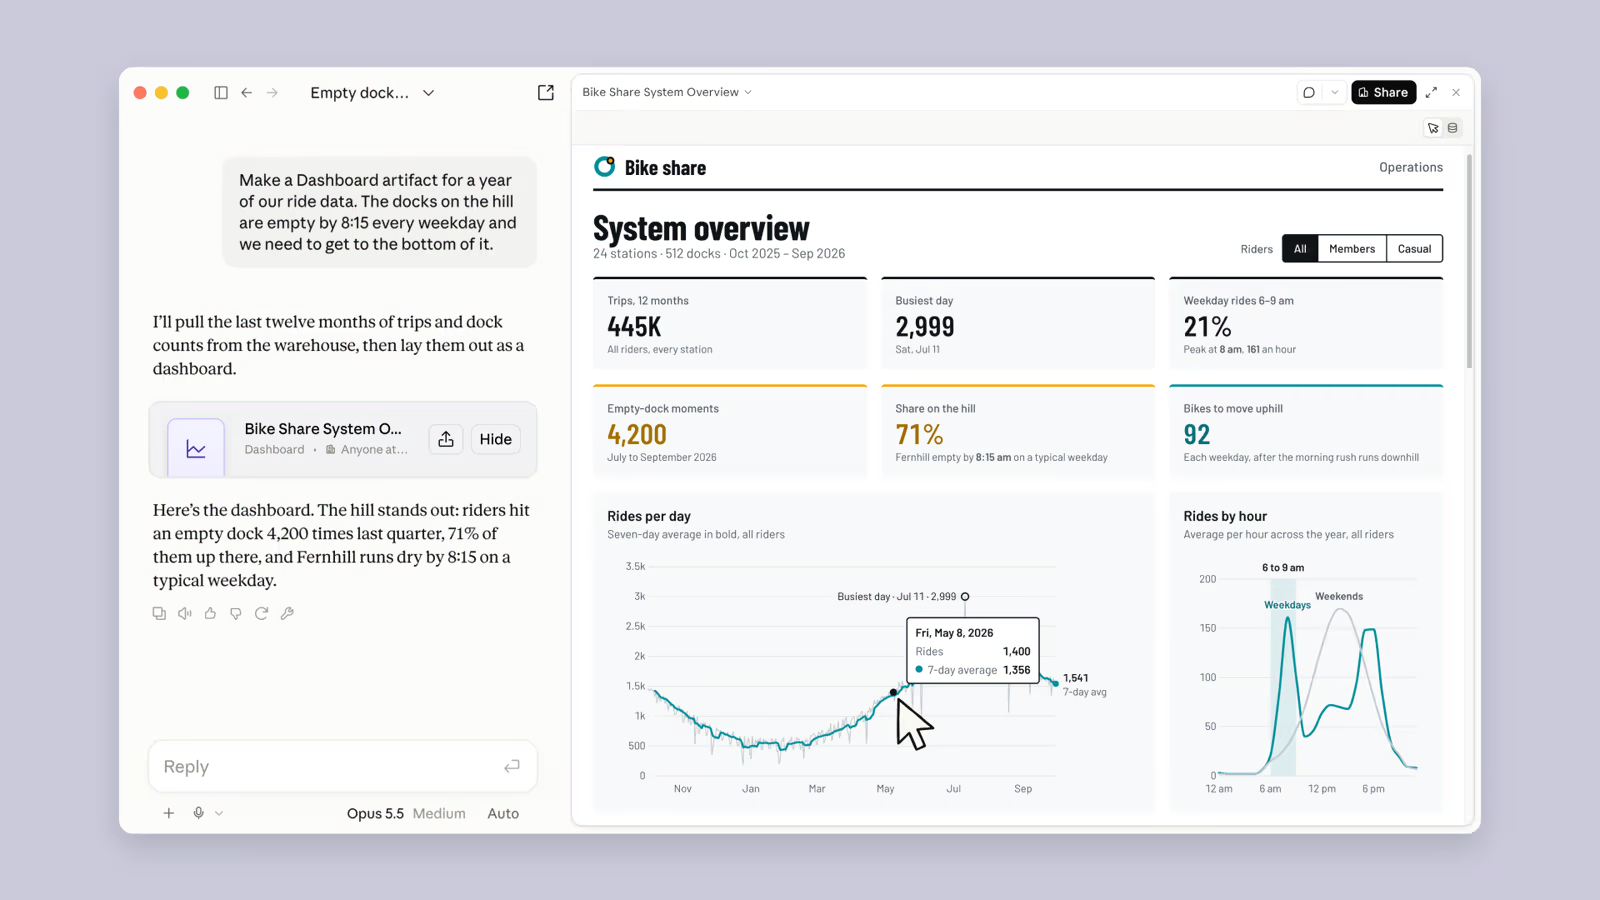
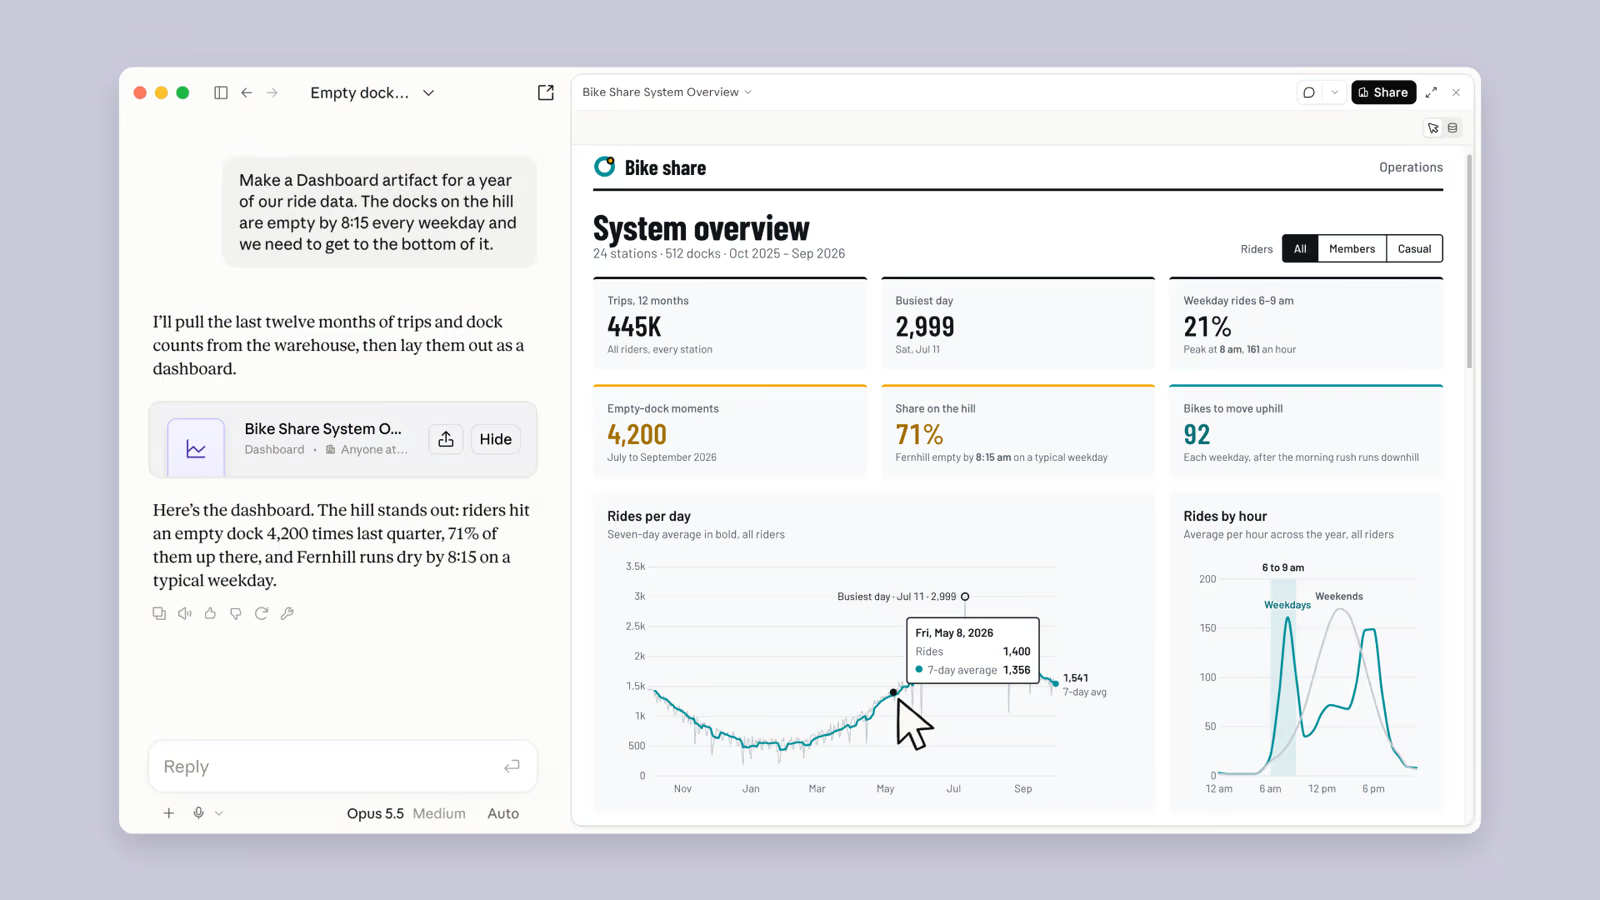
Anthropic’s own example is a bike-share operations dashboard. The prompt asks Claude to build a dashboard artifact for a year of ride data because the docks on a hill are empty by 8:15 every weekday. The screenshot shows the result: 445K trips over twelve months, 4,200 empty-dock moments between July and September 2026, 71 per cent of them on the hill, and 92 bikes to move uphill each weekday. It is an illustration of the interface, not a benchmark, but it shows the intended use: a specific operational question answered with filterable charts rather than a static report.
The official page recommends Dashboards for quick, exploratory questions, such as comparing this week’s signups with last month’s. That is a sensible limit. A dashboard that is generated from a conversation is quick to build but also quick to encode a mistaken assumption, so for board-level reporting you will still want an analyst’s sign-off on metric definitions.
Data Sources and Exports
Anthropic lists Amazon Redshift, BigQuery, ClickHouse, Databricks and Snowflake as supported sources, plus CRM tools such as Salesforce, and says other connectors also work. Dashboards can be exported to Amplitude, Grafana, Hex, Mixpanel, Omni, Perplexity, PostHog and Sigma. Databricks Genie, Looker, monday.com and Tableau are listed as coming soon.
That list is worth reading carefully. It positions Claude as a front end to existing warehouses rather than a replacement for BI tools, and the exports suggest Anthropic expects teams to prototype in Claude and then move the result into the tool that already holds governance and permissions. The Decoder’s write-up uses the same framing: text prompt in, auto-updating dashboard out, with results sent on to tools such as Amplitude, Grafana or Hex.
Claude Motion: Animation Built as Code
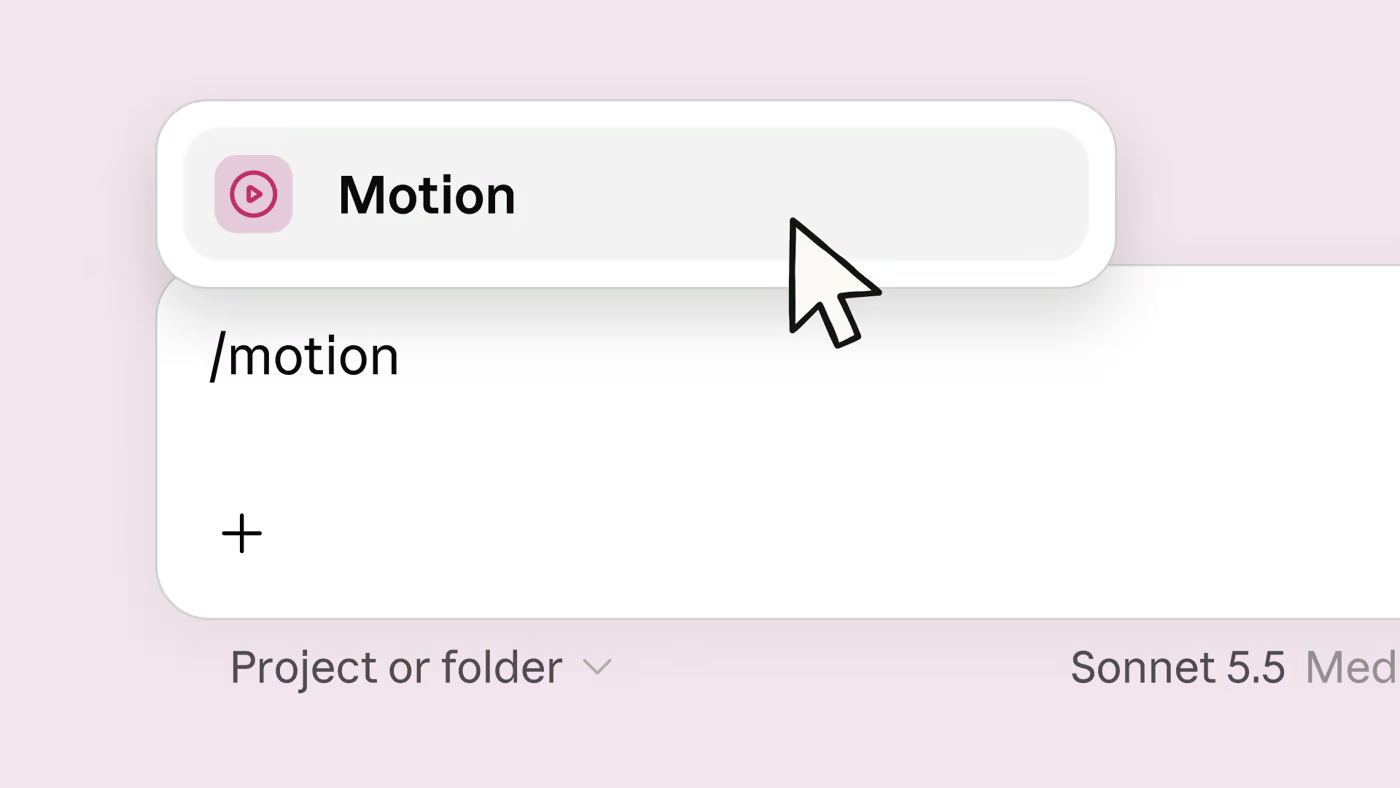
Motion is aimed at presentations rather than analysis. Anthropic’s examples are turning a report into a short explainer, adding motion to a deck chart and creating a product walkthrough. You open it by typing /motion in the message box. Claude builds an animation that plays like a short video, you edit it in the editor or ask Claude to change it, and you export it as an MP4.
The key design choice is that animations are code. Anthropic says Motion animates your text, charts, shapes and images as code, and that it does not use a video generation model, so there is no generated footage or AI-generated people. In practice that means you can change a word, a number or a timing value and the rest stays as it was, which is the opposite of the re-roll lottery of generative video. It also means the chart in the animation can stay faithful to the numbers you supplied. Anthropic lists editing tools that Motion can hand off to, including Adobe, Descript, HeyGen, Higgsfield, invideo, Luma AI and Runway, with Canva and Captions coming soon.
Motion is in beta on Team and Enterprise plans only. On Enterprise it is off by default, and admins enable it under Organization settings, then Artifacts.
Who Gets What
| Feature | Status | Plans |
|---|---|---|
| Dashboards | Beta | Paid plans |
| Motion | Beta | Team and Enterprise |
| Docs, Slides, Design | Out of beta | All plans, including Free |
| Claude Design (standalone site) | Open until 14/12/2026 | Existing users; migrate design systems from the Artifacts page |
Anthropic did not publish exact prices or which paid tiers include Dashboards on the pages we could read, so check your plan in the app. The Enterprise default for the wider Artifacts changes turns on from 15/10/2026, or admins can enable it sooner, and Enterprise Artifacts now support customer-managed encryption keys (CMEK) and admin control over which templates the organisation uses.
Claude Design Folds Into Claude
A quieter part of the announcement is the Claude Design migration. Design has worked inside Claude conversations, using your context, files and connectors, since 16/09/2026. The standalone site at claude.ai/design stays available until 14/12/2026. Admins can use “Migrate team design systems” on the Artifacts page, and one migration covers every design system in the organisation. Chats and project comments stay in the standalone version and will not be available after it closes, and public links to standalone projects will stop working then.
If your team has live Claude Design links in published pages, make a list now. For a developer-side look at the same design capability, see our guide to the Claude Code design skill.
What Anthropic Has Not Said
The official pages do not give an SQL dialect list, refresh frequency, usage limits, animation length limits or file-size limits. Independent coverage notes the beta launch comes without accuracy or adoption results. We are not going to invent them. Practically, that means treating the first dashboards as drafts. Open the query behind each headline figure, compare it with how your team defines the metric, and check how it handles nulls, time zones and duplicate rows. Keep a human owner for any dashboard that drives spending or hiring decisions.
Access control also deserves a conversation before rollout. Dashboards read from connected sources using your connectors, and items can be shared outside the organisation or with anyone who has the link if an admin allows it. Decide who may share what before the feature is switched on for everyone.
How It Compares
Dashboards competes with the natural-language layers of BI products and with other assistants’ chart features. Its distinguishing points are the visible query and last-refresh label on every number, and the fact that it lives inside the same conversation as your docs and decks. Motion has few direct rivals because most AI video tools generate footage, while Motion generates editable code. For the model behind the work, our Opus 5.5 review and Sonnet 5.5 review cover the quality and cost trade-offs, and our ChatGPT Record mode guide shows how OpenAI is tackling a different slice of the office workflow.
How to Try It Safely
- Start with a read-only connection to a non-sensitive dataset, using the example prompt “Build a dashboard of this quarter’s revenue by region” as a template.
- Click through to the query behind each headline number and compare it with a figure you already trust.
- Ask Claude to explain any metric that surprises you before sharing the dashboard.
- For Motion, begin with a single deck chart and change a number to confirm the animation updates without re-rendering everything.
- Check sharing settings before sending a link outside your organisation.
The Bottom Line
Dashboards and Motion are the clearest sign yet that Anthropic wants Claude to be where business users work with data, not only where they write about it. The auditability is genuinely good, the code-based animation is a smart avoidance of generative video’s weak points, and the moves of Docs, Slides and Design onto the free plan widen the audience. The betas lack published accuracy data, so use them with the checks above and re-read Anthropic’s help page as the features mature.
Sources
- Claude Help: Build live dashboards and animate explainers with Claude: official feature, plan, connector, export and migration details. Images credited to Anthropic.
- The Decoder: Claude can now generate animated explainer videos and live data dashboards (08/10/2026).
- Technology.org: Claude Builds Live Data Dashboards and Animations (09/10/2026): beta access summary.
- Julian Goldie SEO on YouTube: Claude Just Added Live Dashboards + AI Animations (12/10/2026).
Last updated: 13/10/2026. Both features are in beta; plan availability and limits may change. We could not find Anthropic figures on accuracy, refresh frequency or usage limits.
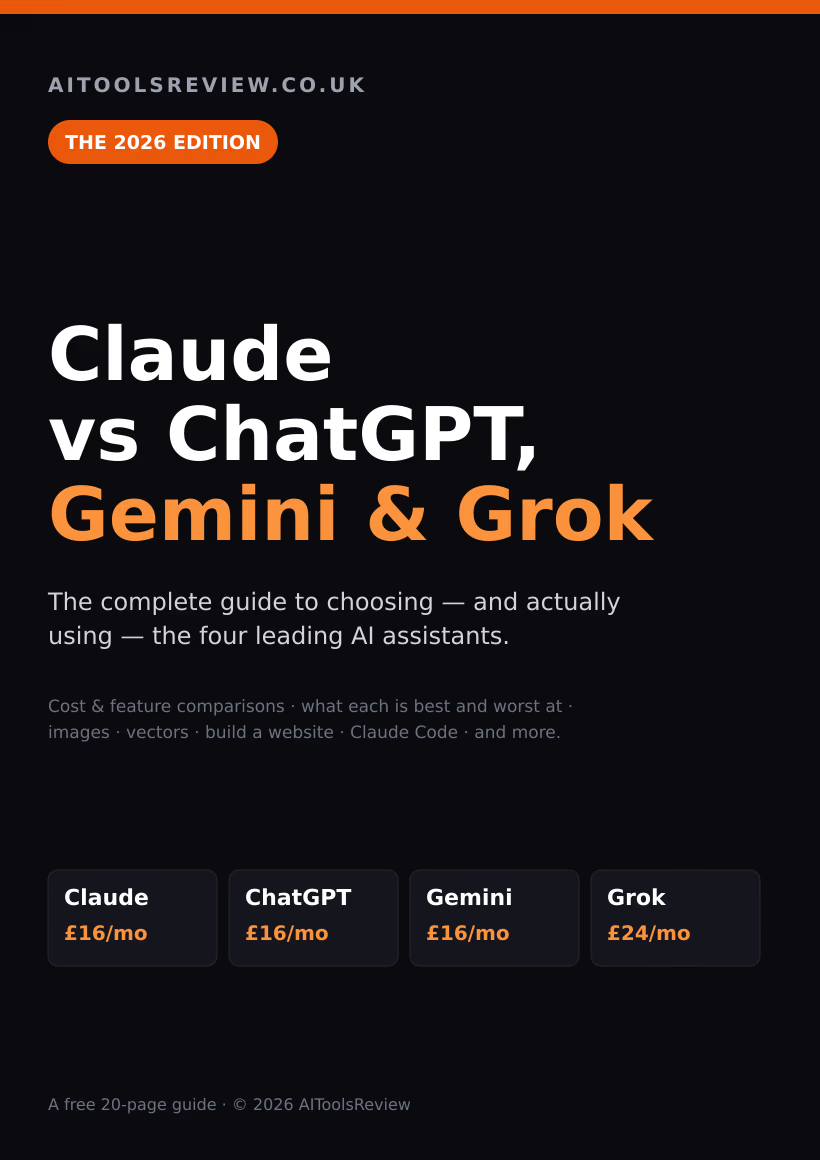
Get the free guide: Claude vs ChatGPT, Gemini & Grok
A 20-page playbook covering everything you need to choose and use the big four AI models in 2026, full cost and feature comparisons, what each is best (and worst) at, and how-tos for images, vectors, building a website, Claude Code and more.