Datadog Claude Connector: The Complete Guide
Quick Answer:
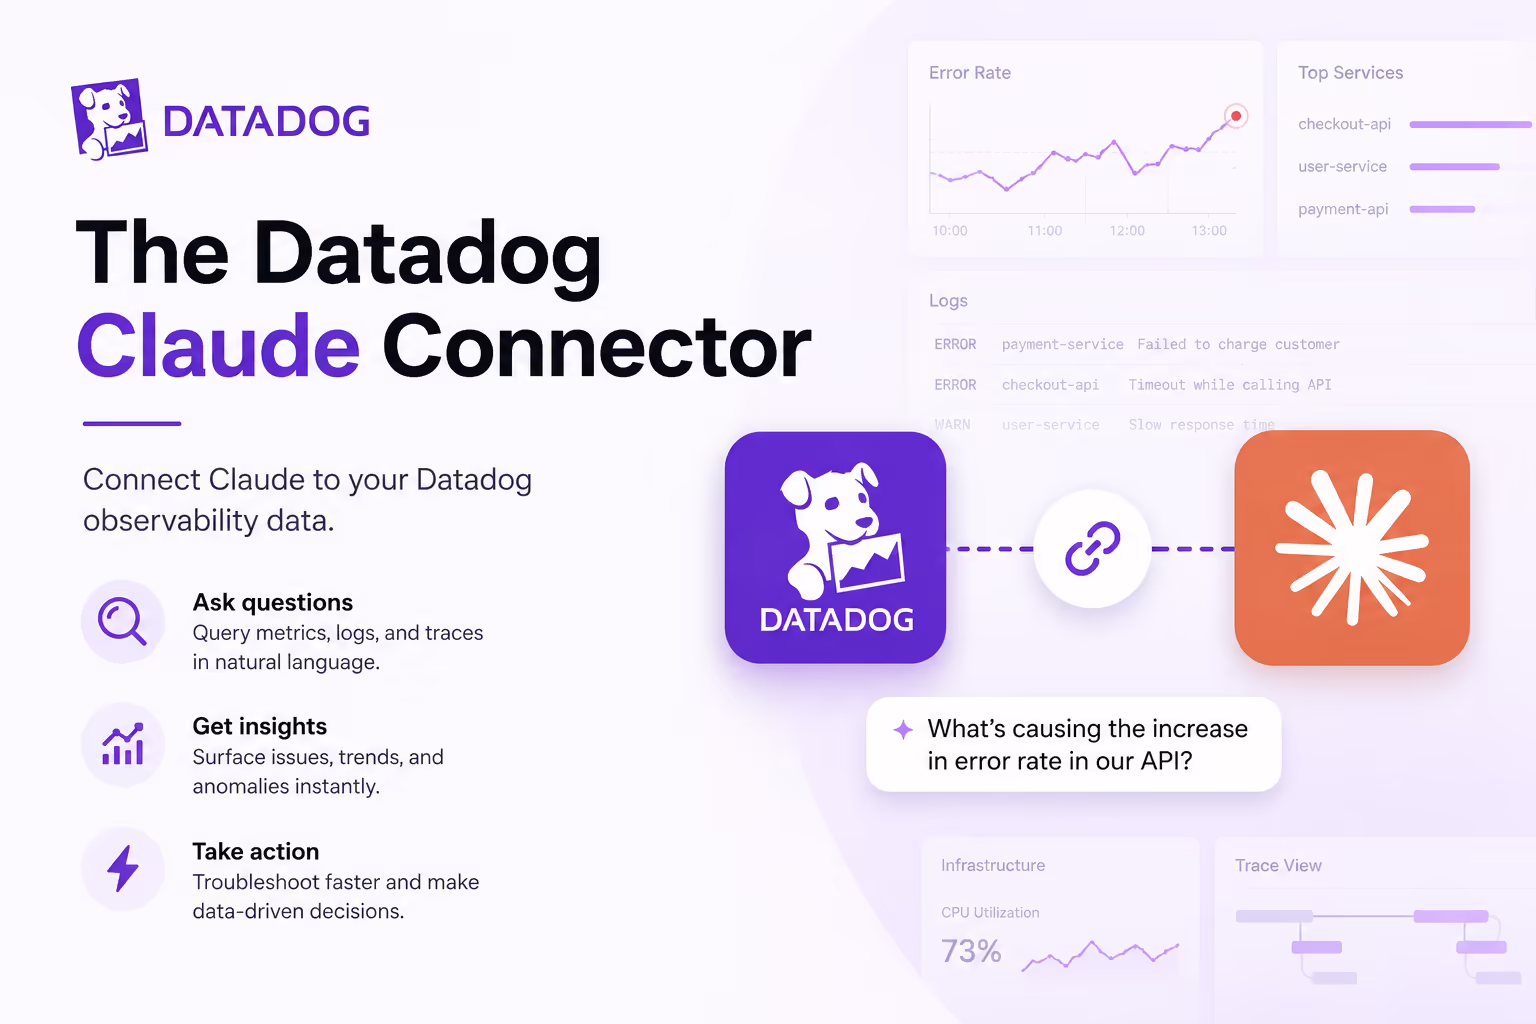
The Datadog MCP connector exposes Datadog's observability surface to Claude - monitors, metrics, logs, APM traces, dashboards, incidents, hosts, services, events and notebooks - so an agent can investigate production behaviour from inside Claude Code or Claude Desktop. Datadog publishes it officially under Bits AI with a dedicated product page. Find it in the Claude Connectors Directory.
Incident response is a tab-switching marathon: terminal, dashboards, logs, traces, monitors. Datadog's MCP collapses it into one conversation.
For on-call engineers, that's not a productivity tweak - it's a different kind of incident loop.
Overview
The Datadog MCP Server acts as a bridge between the observability data in Datadog and AI agents that support the Model Context Protocol. It provides structured access to the relevant Datadog contexts and features so AI-powered clients like Claude Code can query and retrieve observability insights without switching tools.
Datadog documents the connector under its Bits AI surface, runs a public product page describing the design, and publishes the datadog-labs/mcp-server repository alongside an active community of integration write-ups.
The architecture is built around toolsets - named bundles of tools you opt into per connection. Only the core toolset loads by default; everything else is enabled with a query parameter on the endpoint URL, such as ?toolsets=apm,llmobs or ?toolsets=all, and individual tools can be excluded with ?omit_tools=search_datadog_logs,search_datadog_spans. Datadog's setup docs list well over a dozen generally available toolsets - including alerting, cases, dashboards, dbm, ddsql, error-tracking, feature-flags, kubernetes, llmobs, networks, product-analytics, profiling, security, software-delivery, synthetics and workflows - with apm, code-exec, remote-actions and rum still in Preview. The same docs list more than a dozen supported clients, from Claude and Claude Code to Cursor, VS Code, JetBrains IDEs, Gemini CLI, Warp, Codex and Goose.
What the Claude Connector Does
With the Datadog MCP connected, Claude Code can:
- Query monitors - list, inspect, and surface state.
- Pull metrics - understand trends, spikes and SLO performance.
- Search logs - trace errors back to their source.
- Read APM traces - identify latency bottlenecks and slow spans.
- Check dashboard data - get the answer the dashboard is telling.
The Full Capability Surface
Beyond the core debugging triad (monitors / metrics / logs), the connector exposes:
- Traces - APM spans for latency and dependency analysis.
- Dashboards - the views your team has already built.
- Monitors - both for state and configuration.
- Incidents - declared incidents and their history.
- Hosts and services - the infrastructure topology.
- Events - deploy markers, audit events, custom signals.
- Notebooks - investigation artefacts.
That coverage is what makes the connector credible as an incident-response participant rather than just a metric lookup.
Real Use Cases
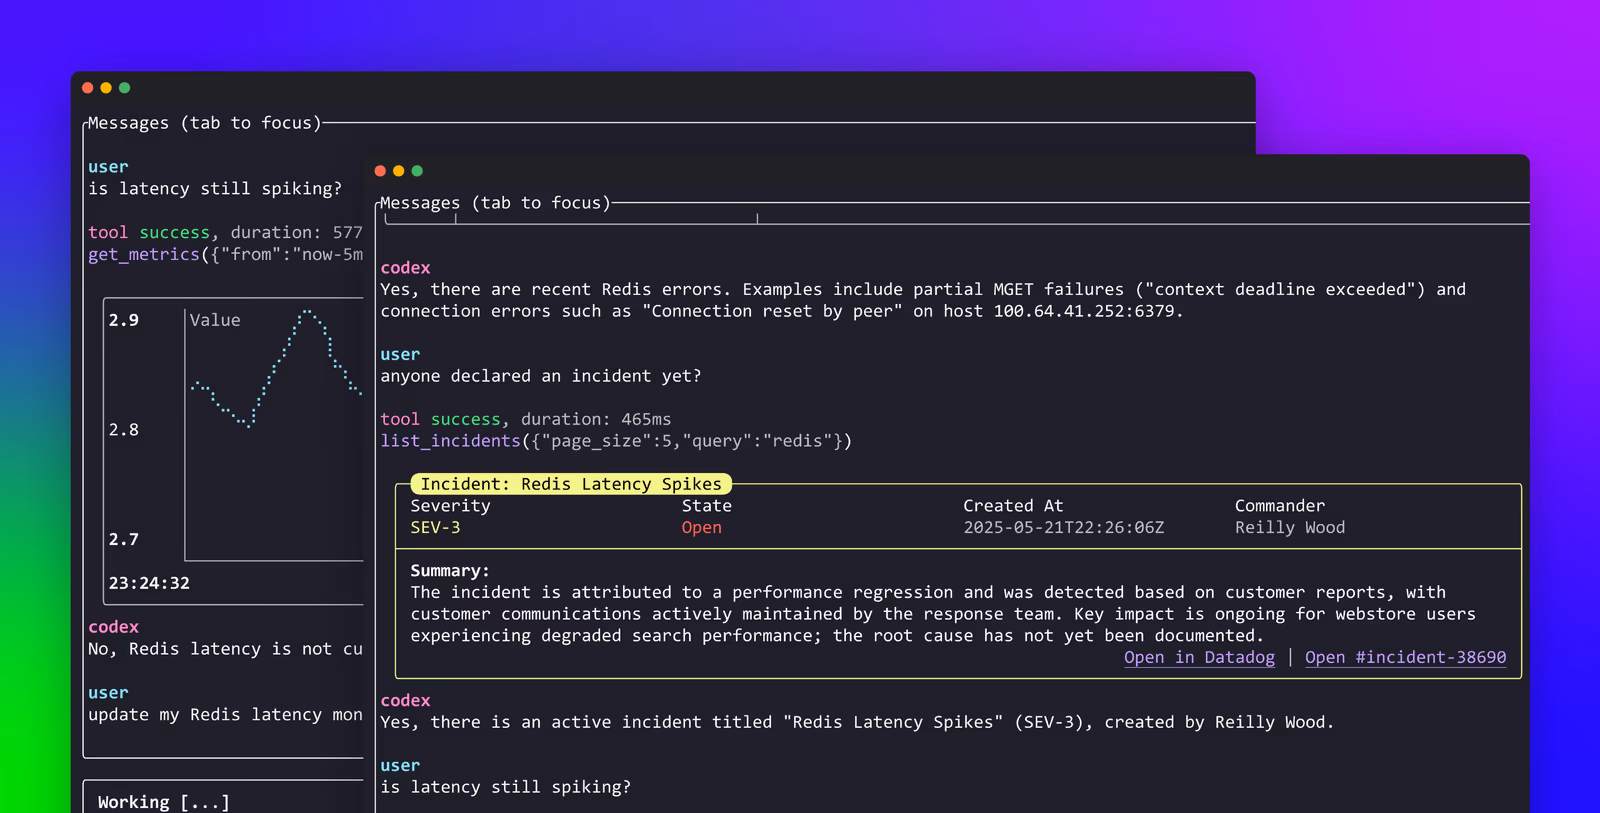
- Live incident triage: "What's broken right now?" - Claude lists firing monitors, pulls the matching error logs and trace samples.
- Pre-deploy sanity check: "Show me the last 30 minutes of error rate on service X" before flipping a flag.
- Latency hunting: "Which downstream is slow on requests above the p95?" - APM trace inspection on demand.
- Root-cause narrative: Claude assembles metrics, logs and traces into a plain-English summary for the incident channel.
- Dashboard recap: "Summarise yesterday's traffic dashboard for the standup."
- Production context inside the IDE: while shipping a fix, the agent reads live production behaviour without leaving the editor.
A Worked Example: Incident Without Tab-Switching
- An alert fires for the checkout service.
- You ask Claude: "What's the current state of the checkout monitors?" - Claude lists them and the state.
- "Pull the error logs for the last 15 minutes" - Claude searches Datadog logs and surfaces samples.
- "Show me the slow traces during the spike" - APM traces appear, ranked by latency.
- "What deployed in the last hour?" - Event search shows the deploy marker for the suspect service.
- Claude assembles a concise narrative for the incident channel.
- You roll the fix, and Claude verifies the monitor is back to green.
No tabs. No manual copy-paste. The observability tooling answers in line with the code editor where you'd be fixing it anyway.
Real-World Experience
Reception across Datadog's own product page, the Bits AI docs, Merge.dev, Composio (both Claude Code and Claude Agent SDK toolkits) and Datadog's Knowledge Centre primer on MCP servers has been strongly positive. The repeated theme: incident investigations get noticeably faster, particularly during the first ten minutes when context-gathering dominates.
Honest counterpoint: an agent with access to your full observability surface needs to be steered. Asking "what's wrong?" with no context will return everything that's not green. Engineers who scope the query get the most leverage.
How to Set It Up
Datadog ships a remote MCP server authenticated over OAuth, so there is no API key to paste and no local process to babysit. The smoothest path for Claude Code is the official Datadog plugin from Anthropic's plugin marketplace, which packages the MCP server together with a set of skills and keeps itself updated.
Claude Code via the plugin (recommended)
Add Anthropic's plugin marketplace, then install the Datadog plugin:
/plugin marketplace add anthropics/claude-code /plugin install datadogOn first use, run /ddsetup (or simply issue any Datadog prompt). Claude asks which Datadog site you are on - for example datadoghq.com, datadoghq.eu or us3.datadoghq.com - then opens an OAuth login. Once authorised, the server's tools are live. Use /ddtoolsets at any time to enable or disable groups of tools so the agent only sees the surface you want.
Adding the remote server directly
If you prefer not to use the plugin, add the remote server URL for your site by hand and complete the same OAuth flow:
claude mcp add --transport http datadog https://mcp.datadoghq.com/api/unstable/mcp-server/mcpSwap the host for your region (mcp.datadoghq.eu, mcp.us3.datadoghq.com and so on). The full, current setup steps live in Datadog's Set Up the Datadog MCP Server docs at docs.datadoghq.com/bits_ai/mcp_server/setup. Choosing the wrong site is the single most common setup mistake - see below.
What to Enable First
Datadog's own guidance for keeping the surface manageable: for most debugging and incident workflows, monitor retrieval, metric queries and log search cover the common cases. Add APM traces once your team is comfortable using the agent in a live incident; add dashboards when you want narrative summaries instead of raw data.
Security and Permissions
The connector inherits your Datadog access - it can see what your account can. Observability data is often the most sensitive in an org (logs may contain PII, traces can carry request payloads), so scope the agent's access deliberately. Audit access by team and consider read-only on production-sensitive scopes. The standard hygiene applies.
Datadog also layers MCP-specific permissions on top of the normal role model: mcp_read gates tools that read data from Datadog, and mcp_write gates tools that create or modify resources - and both compose with the underlying resource permissions, so reading monitors via the agent still requires the Monitors Read permission. That gives admins a clean way to make the connector read-only for most users. Authentication is OAuth 2.0 by default, with an API-key and application-key header pair (DD_API_KEY / DD_APPLICATION_KEY) documented as the fallback for environments where a browser OAuth flow isn't feasible.
Common Problems and Fixes
Most Datadog MCP friction is configuration, not bugs. These are the issues that recur in setup threads and Datadog's own troubleshooting notes.
Wrong Datadog site - "unauthorized" or empty results
Datadog runs separate regional instances (US1, US3, US5, EU, AP1, US1-FED) and the MCP host must match the org you are in. Point at datadoghq.com when your account is on the EU site and you'll get an auth failure or eerily empty responses. Confirm your site from the URL of your Datadog dashboard and re-run /ddsetup with the correct one.
OAuth completes but no tools appear
If authorisation succeeds yet Claude reports no Datadog tools, a toolset is probably disabled. Run /ddtoolsets and enable monitors, metrics and logs. In Claude Desktop, also confirm npx is on PATH so the remote proxy can launch.
Broad queries blow the context window
"What's wrong?" with no scope returns every non-green signal in the org and can saturate the context window. Always bound queries by service, environment and time range - "checkout service, prod, last 15 minutes". If a session is already overloaded, start a fresh one.
Permission gaps mid-investigation
The agent inherits your Datadog role exactly. If a teammate's account can't read APM traces, the connector can't either - you'll see a permission error, not missing data. Grant the relevant Datadog role and retry.
Plugin drift
The marketplace plugin auto-updates, but a stale install can lag behind new toolsets. If a documented tool is missing, run /plugin install datadog again to refresh, then restart Claude Code.
Pricing and Availability
The MCP server itself carries no separate licence fee - it is bundled with your existing Datadog subscription and exposes data you already pay to collect. There is no extra charge to connect Claude. What can move your bill is the underlying Datadog usage the queries imply: log search, APM trace retention and indexed spans are metered as normal, so an agent that runs many broad log or trace queries consumes the same retention and indexing budget any human query would.
Datadog emits telemetry about the connector itself - metrics such as datadog.mcp.session.starts and datadog.mcp.tool.usage - so you can monitor how heavily teams lean on it. The server is generally available across Datadog's regional sites; check the setup docs for the current host list for your region.
Two availability boundaries from the official docs are worth flagging: the US government sites (app.ddog-gov.com and us2.ddog-gov.com) are not supported at all, and whilst the server is generally available for most clients, the ChatGPT app integration is still in Preview and limited to US1 customers - Claude users are on the GA path.
Limitations
- Surface area: Datadog is vast; broad queries return a lot - scope them.
- Read-leaning: the connector excels at retrieval and reasoning rather than mutating observability state.
- Data sensitivity: logs and traces can contain sensitive payloads - scope carefully.
- Vendor-shaped: deep on Datadog, narrower on multi-vendor observability stacks.
Who It Is For
SREs, on-call engineers, platform teams and any developer responsible for production. Any organisation running Datadog as its primary observability stack will recoup time the moment incidents start.
The Bottom Line
The Datadog MCP turns Claude into a credible incident-response participant. Monitors, metrics, logs, traces, dashboards - all answer in the same conversation that contains the code. For on-call and SRE teams, the gain on the first ten minutes of an incident is real, and that's the most expensive ten minutes in production engineering.
Start with monitors and logs, layer in traces, and let Claude carry the context-gathering you'd otherwise be doing across six tabs. Browse more in the complete Claude Connectors Directory.
Sources: Datadog (docs.datadoghq.com/bits_ai/mcp_server, datadoghq.com/product/ai/mcp-server, datadoghq.com/knowledge-center/mcp-server), github.com/datadog-labs/mcp-server, Merge.dev, Composio. Image: Datadog. Last updated: June 2026.
Frequently Asked Questions
What does the Datadog connector let Claude do?
Is it official?
Which capabilities should I enable first?
Does it work alongside Bits AI?
Who benefits most?
Related Articles

AI Tools Review Editorial Team Expert Verified
Our editorial team consists of veteran AI researchers, software engineers, and industry analysts. We spend hundreds of hours benchmarking frontier models natively to provide you with objective, actionable intelligence on agentic AI capabilities and cybersecurity landscapes.